SGE CompareArtist – User Manual
www.sge-ing.de – Version 1.62.67 (2022-07-24 22:21)
1 Introduction
The SGE CompareArtist is a tool to compare datasets and visualize their differences.
You can load an arbitrary number of datasets and choose the labels to compare. Filters and powerful visualization enables to keep track of calibration progress and dataset variants.
This manual contains information concerning specifically the SGE CompareArtist only. The SGE CompareArtist is part of the SGE Circus. For help topics regarding general features please refer to the corresponding documentation accessible using the links below.
1.1 SGE Circus user manualThe SGE Circus documentation makes available general information regarding data loading procedure, input handling, preferences, history and other topics concerning all tools. |
1.2 SGE CalcGuide user manualThe SGE CalcGuide is a tool to implement calculation routines by creating graphical flow chart diagrams - included with all tools. |
|
|
|
1.3 SGE Circus videos (external) |
|
|
|
For information regarding the version dependent software changes please refer to the Release notes accessible using the corresponding menu item inside the SGE Circus.
2 Keyboard shortcuts, mouse gestures
Many functions are quickly accessible via keyboard shortcuts. For a list of available keyboard shortcuts, see the list below. In addition, the entries in the menus and context menus as well as the tooltips of the toolbar point to shortcuts.
|
Dataset |
|
|
Add dataset(s) to compare... |
|
|
Save all datasets... |
|
|
Paste dataset files from clipboard into present session. |
|
|
Remove all datasets from comparison... |
|
|
Edit dataset short names... |
|
|
Toggle visibility of dataset top section |
|
|
Right mouse button drag |
Reorder datasets |
|
Label |
|
|
Select label(s) to compare... |
|
|
Transfer labels between datasets... |
|
|
Reset labels to initial values... |
|
|
Rename labels... |
|
|
Label info... |
|
|
Remove label(s) from comparison... |
|
|
Toggle highlighting of selected labels |
|
|
Ctrl + Shift + h |
Remove all highlighting |
|
Copy label names to clipboard... |
|
|
View |
|
|
Run comparison |
|
|
Visualize |
|
|
Visualize (text output) |
|
|
Visualize marked (cross compare) |
|
|
Visualize marked (cross compare, text output) |
|
|
Show only diffs |
|
|
Show only missing labels |
|
|
Ignore missing labels |
|
|
Increase font size |
|
|
Decrease font size |
|
|
Filter |
|
|
Filter view regarding label names |
|
|
Filter view regarding function names |
|
|
Edit filters... |
|
|
Remove active filter |
|
|
Online |
|
|
Toggle online mode |
|
|
Miscellaneous |
|
|
Save session... |
|
|
Show manual... |
|
|
Show keyboard shortcut manual... |
|
3 Features
The main features of the SGE CompareArtist are listed in this introduction. For details please see the following sections.
Datasets
Dataset sources
DCM-, PaCo-, CDFX-files
Mectronik MeCal files (*.rbe, *.rbs, *.apu, *.rex, *.mke)
BMW Race Calibration files (*.bmwrc*)
ETAS INCA software
Handling of any number of datasets
Short name assignment for convenient dataset identification
Temporary deactivation of datasets to adjust comparison composition
Labels
Various predefined label sets “All master labels”, “All labels from all datasets”, “All labels from active datasets”
Individual label selection with history for quick access to recent settings
Read label list from *.lab, *.dcm, *.paco, *.cdfx file and other formats
Read from clipboard
Label info enables to access general label information regarding description, axes, rages ...
Label highlighting to emphasize and remember label subsets
Label renaming to e.g. harmonize naming of multiple ECU labels
Comparison
Clearly arranged comparison result table with indication ob label type and difference type
Filters allow to quickly adjust the result regarding label names, functions, label types, missing labels
Configurable comparison tolerance
Visualization
Textual and graphical representation of comparison for one or multiple labels
“Cross comparison” allows to compare labels with different label names
Transfer
Transfer labels between datasets
Common axis handling
Unequal axis breakpoint number handling
Unequal dimension handling
4 Datasets
Calibration data to be managed using the CompareArtist must be stored in calibration data files (e.g. DCM, PaCo, CDFX, MeCal or others) or handled inside ETAS INCA software. Any number of datasets can be loaded simultaneously.
Exactly one dataset will be the master dataset. Its values will be the reference to compare all other dataset to.
4.1 Load datasets
To load a dataset into the CompareArtist use the “+” buttons at the right border of the main window or the corresponding menu item. A dataset will always be added below the dataset placed in the line of the used “+” button. Multiple files can be loaded at once. When you add, remove or reorder datasets the labels to compare will be updated automatically only when you selected “All master labels”, “All labels from active datasets” or “All labels from all datasets”.
To reload or replace a dataset press the button with the “open folder” sign right to the dataset name.
A dataset can be loaded either from a calibration data file (e.g. DCM, PaCO, CDFX, MeCal or others) or from a running ETAS INCA software. It is also possible to load session files.
Source calibration data file
The file(s) to load the dataset from will be asked. When adding new datasets multiple files can be selected at once. When replacing a dataset only one file can be selected. Various file formats are supported – e.g. DCM, CDFX, PaCo, MeCal and BMW Race Calibration.
It is also possible to load session files using this dialog.
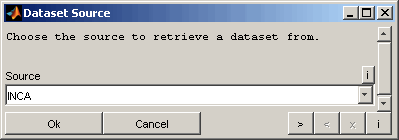
Source INCA
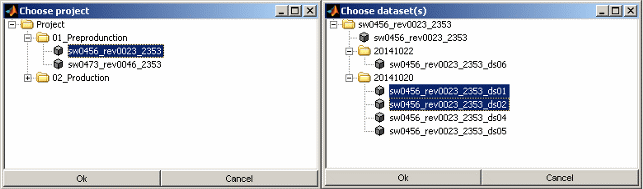
When loading datasets from ETAS INCA software you will be asked to select the project and dataset(s) from a tree view showing the actual INCA database.
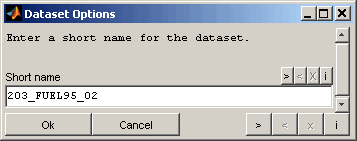
Short name
An optional short name for the dataset will be asked if a single dataset was loaded. A short name is a convenient way to identify datasets in the main view and visualization windows for datasets with long file names. In case of loading multiple datasets at once the short names will be applied automatically. The dataset short names can be modified after loading the datasets using the corresponding menu item (F2).
No data will be loaded from the selected files or INCA at this point of time. Data will be loaded on demand when a comparison is run.
In case of a file modification during a CompareArtist session or when reloading a session it will be detected and the data will be reloaded from file. This is only true for datasets loaded from file. Changes to datasets retrieved from ETAS INCA software will not be detected. Missing files will be ignored as long as no data has to be loaded to enable working with session even if files are missing.
4.2 Drag and drop, paste datasets
In addition to using the file load dialog, you can load datasets and sessions from file by using drag and drop or the clipboard. To do this, one or more files can be dragged directly to the CompareArtist session or inserted via keyboard shortcut (Shift + v). It is also possible to copy files directly to the clipboard as well as strings containing the file names line by line.
4.3 Save datasets
Datasets can also be saved. The datasets are either saved partially or completely into a calibration parameter file, a MATLAB script or transferred to ETAS INCA software.
There are basically two modes available for saving.
"Save all datasets" (Ctrl + s) allows you to save several or all records at the same time. The target remains unchanged. Records loaded from a file are therefore saved into the same file. Datasets that have been transferred from ETAS INCA are transferred there again. There is no query of files or INCA records - the targets are overwritten.
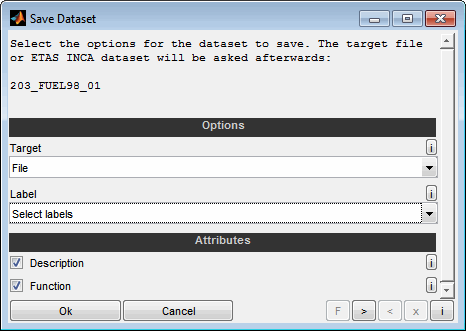
When saving a single data set using the button right from the data set button, the destination can be selected. You can switch between file and ETAS INCA and the specific file or the INCA dataset is queried.
Correspondingly, different options are queried for both cases.
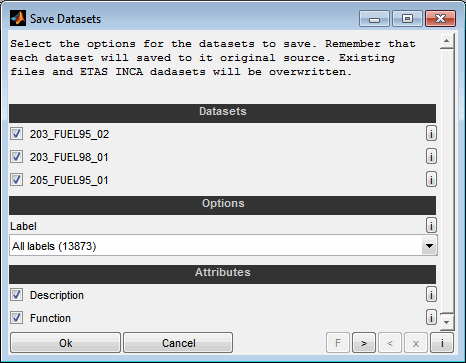
Datasets
Select the datasets to save. This options is only present when “saving all datasets”.
Target
Select whether to save the dataset to a calibration parameter file (*.dcm, *.cdfx, *.dcmat, MATLAB script and others) or to transfer it to ETAS INCA software. This options is only present when “saving a single datasets”. In this case the target will or the ETAS INCA dataset will be asked afterwards similar to the dataset loading process. Otherwise there is no query of files or INCA records - the targets are overwritten.
Label
Select the labels to save. You can select whether to copy all labels, the labels of the comparison result table, the highlighted labels or the selected labels from the comparison result table only. Additionally the labels can be selected manually.
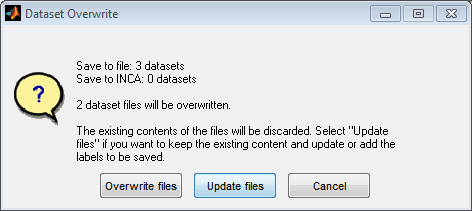
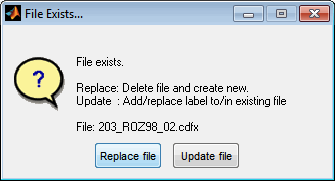
When saving a dataset with a reduced choice of labels the resulting dataset files will not be complete any more. For this reason, warnings will be displayed that point out this and offer the possibility to choose between replace and update. While replace creates a reduced dataset containing only the selected labels, update adds the labels to the existing dataset and updates existing labels.
Attributes
Select whether to save attributes like the textual description and the function of the labels.
4.3.1 Save dataset as MATLAB script
If a single dataset is saved, it can be saved as a MATLAB script (*.m). When this script is executed in MATLAB, the parameters of the dataset are created in MATLAB workspace and are available for calculations and simulation in MATLAB and Simulink.
The following options are requested in this case:
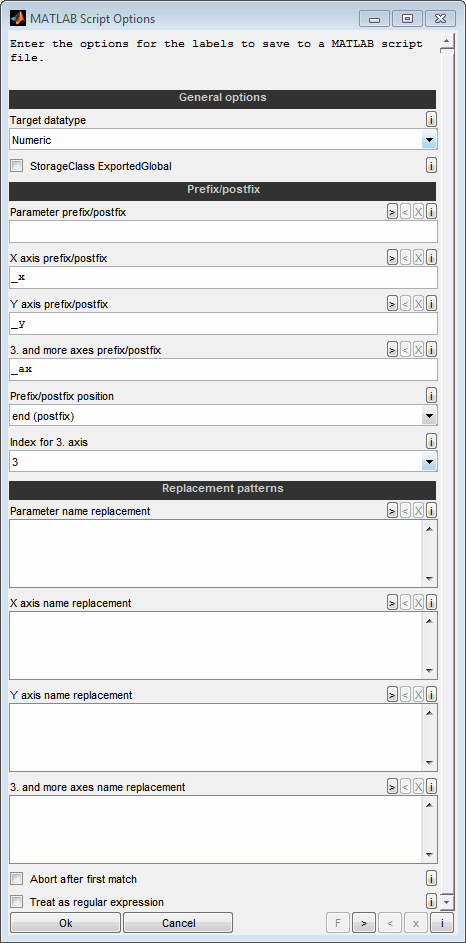
Target datatype
Decide whether you want to generate the parameters as numeric variables (e.g. scalar, curve, map) or as Simulink.Parameter type.
StorageClass ExportedGlobal
Decide whether you want to set the storage class for the created parameters to ExportedGlobal.
Parameter prefix/postfix
You can append any text before or after the name of the parameter. Basis is the name as it was loaded in CompareArtist. Typically this field is empty to not change the name.
X/Y prefix/postfix
You can append any text before or after the name of the X/Y axis. Basis is the name as it was loaded in CompareArtist. This field typically should not be empty to make sure to have an individual axis name differing from the prameter name.
Example:
"_x"
3. and more axes prefix/postfix
You can append any text before or after the name of the 3. and more axes. Immediately after this text, a number is automatically appended which represents the number of the axis. The number depends on the following settings. This field typically should not be empty to make sure to have individual axes names differing from the parameter name.
Example:
"_ax" will lead to _ax1, _ax2...
Prefix/postfix position
You can append any text before or after the name of the parameter. Immediately after this text, a number is automatically appended which represents the number of the axis. The number depends on the following setting.
Index for 3. axis
For the third and following axes, a number is automatically appended to the text of the previous setting. Decide here which number is used for the third axis. All following axes will then have correspondingly higher numbers.
Parameter / axis name replacement
You can use replacement rules for the parameter names. One rule per line. The string to look for and the replacement are separated by two colons, like "Map :: Table". The replacement is case sensitive, done in the order of lines from top to bottom and after appending the prefix/postfix. Make sure to generate valid MATLAB variable names.
Example:
Map :: Table
Abort after first match
If enabled the replacement for a parameter will be aborted after the first rule leading to a change. Otherwise all replacement rules will be applied sequentially.
Treat as regular expression
If enabled the replacement patterns are interpreted as regular expression.
4.4 Remove all datasets
To create a clear initial state all datasets can be removed at once.
4.5 Check files
The files the datasets were loaded from are remembered.
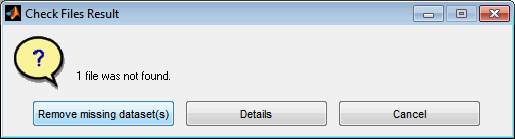
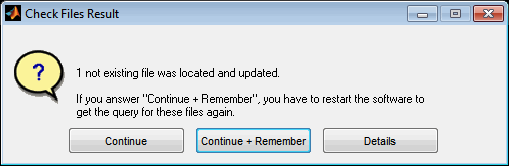
It may happen that files have been renamed or moved during the work or after reloading a session. Use the “Check files” option in this case to search the missing files and update their names and path automatically. Remember that sometimes it is not possible to find missing files. Datasets corresponding to missing files can be removed from the comparison.
The option “Continue + Remember” in case of a successful search allows you to save search results and apply them quickly next time without prompting. To reset these saved replacements, the software must be restarted or the corresponding option must be used when the message after automatic replacement is displayed.
4.6 Arrange datasets
Each datasets is listed in one line at the upper section of the main window. The upper most dataset is always the master dataset.
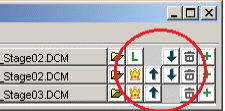
To modify the order of the datasets use the “arrow” buttons right of the dataset names or just drag the dataset buttons using the right mouse button. Use the “crown” button to make a dataset the master regardless of its actual position in the list.
To remove a dataset from the comparison use the “trash bin” button.
4.7 Activate / deactivate datasets
Datasets loaded can be active or inactive. Only active datasets take part in the comparison result. Datasets are active by default. To deactivate a dataset press the button containing the dataset name. Buttons of inactive dataset are displayed sunken and with a faded out dataset name.
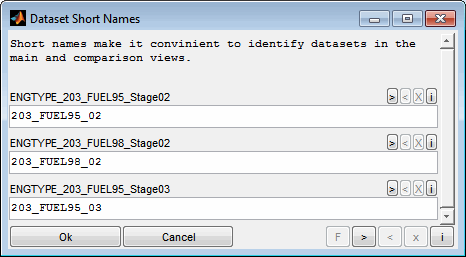
4.8 Edit dataset short names
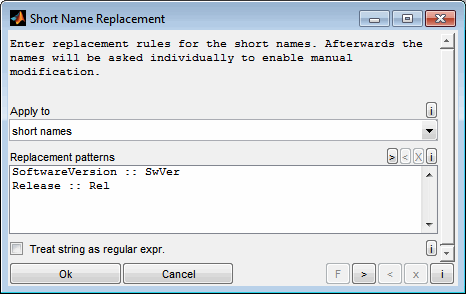
Short names describe each dataset and are used to identify the datasets in the comparison result table and other views. Edit the short names to ensure a meaningful and unique description. The dataset short names can be edited even after loading the datasets (F2) in a two step procedure.
In the first step you will be asked for replacement patterns. Decide whether to apply the rules to the dataset source or the actual short names. These replacement rules are applied to all datasets and are useful to do common renaming tasks. The replacement patterns are given one rule per line. The string to look for and the replacement are separated by two colons, like "SoftwareVersion :: SwVer". The replacement is case sensitive and done in the order of lines from top to bottom. If the corresponding check box is set the strings are interpreted as regular expression.
In the second step you will asked for each short name individually to modify.
After the editing was done a message will inform about the short name modification and allows to undo the changes.
5 Labels
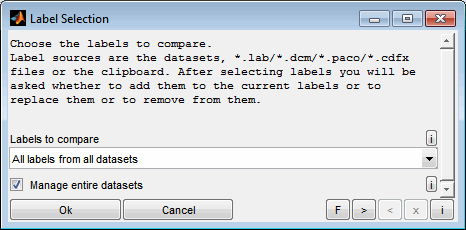
5.1 Select labels to compare
A dataset contains of one or more label(s). The labels to compare must be chosen (Ctrl + l). Different modes are available and it can be chosen if of all data from the datasets is loaded or only the labels to compare.
Label Selection
All master labels
All labels contained in the master dataset will be considered for the comparison.
All labels from all datasets
All labels from all datasets will be considered for the comparison. Labels not contained in the master will be marked as missing. As a comparison is always done to the master no comparison is done for missing labels.
All labels from active datasets
All labels from the active datasets will be considered for the comparison. Labels not contained in the master will be marked as missing. As a comparison is always done to the master no comparison is done for missing labels.
Choose from master master labels
A dialog to select from the master dataset labels will be presented.
Choose from all labels
A dialog to select from all labels of all datasets will be presented. Labels not contained in the master will be marked as missing. As a comparison is always done to the master no comparison is done for missing labels.
Choose from all functions
A dialog to select from all functions will be presented. When selecting the label according to its functions, it is important to consider how the label functions are determined. For this purpose, the functions of the labels are first determined in the master dataset. Only if no function can be found in the master dataset, the other datasets are considered. If the functions of the labels were determined in this way, they are then applied independently of the dataset. If, for example, a label has a function in the master dataset and different function in another dataset, the label is assigned exclusively to the function of the master dataset. Make sure to first load the datasets to enable the function detection.
Read from label list (*.lab)
Label list files (*.lab) will be asked to read the labels to compare from. The file should contain one label name per line. Comments may be appended if they are separated by colon or space. If a [Label] section is defined only labels from this section will be read. It is possible to read from multiple files at once.
Read from label file (*.dcm/*.paco/*.cdfx and others)
Label data files (*.dcm/*.paco/*.cdfx and others) will be asked to read the labels to compare from. Reading from these data files does only read the label names and not the data. It is possible to read from multiple files at once.
Clipboard label list
The clipboard content may be used to define the labels to compare. The clipboard should contain one label name per line. Comments may be appended if they are separated by colon or space.
Manage entire datasets
Choose whether to load all labels from the datasets or only the labels to compare. If this option is selected all labels from the datasets will be loaded and maintained. Therefore adding labels to compare may be done without accessing the data source again. This is useful when working with sessions or datasets loaded from INCA where the data source may not be present any more.
If you intend to save entire datasets from the CompareArtist you need to check this option to have all labels data present for saving. Otherwise the saved datasets will not be complete.
Keep in mind that handling all data increases the session file size.
When you add, remove or reorder datasets the labels to compare will be updated automatically only when you selected “All master labels”, “All labels from active datasets” or “All labels from all datasets”. After selecting labels you will be asked whether to add them to the current labels or to replace them or to remove from them.
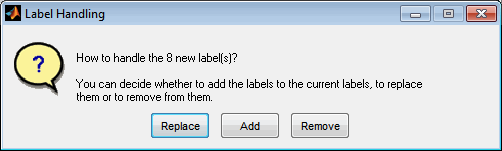
Label Handling
Replace
The loaded labels replace the current ones.
Add
The loaded labels are added to the current ones. Duplicates will be removed automatically.
Remove
The loaded labels are removed from the current ones. Labels not found will be ignored.
Additionally it is possible to quickly remove the selected labels from the comparison view (Delete).
5.2 Transfer labels between datasets
By means of a transfer (F3), labels can be transferred between the datasets and thus the datasets can be changed. It is possible to add new labels as well as overwrite existing ones.
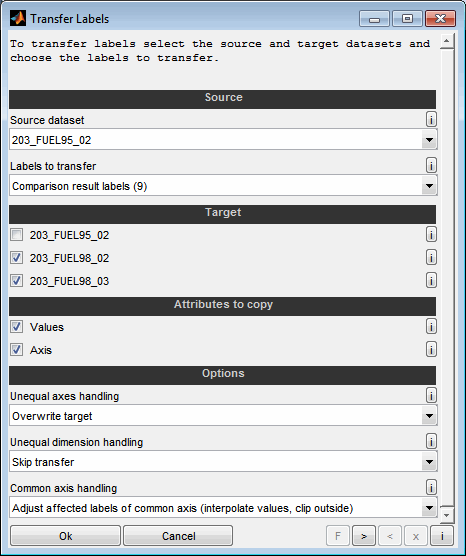
Source dataset
Select the source data set from which the labels to be transferred should originate.
Labels to transfer
Select the labels to transfer. You can select whether to copy all labels, the labels of the comparison result table, the highlighted labels or the selected labels from the comparison result table only. Additionally the labels can be selected manually.
Target
Select the datasets to be a target of the transfer. When selected, the labels are transferred from the source dataset to this dataset. Existing labels are overwritten, new ones added if nothing else is specified using the options below.
Attributes to copy
Select whether to transfer the values and or the axis of the labels. In case the size of the label in the source and target dataset does not match the proceeding depends on the next setting. Unless some interpolation is used the transfer will fail when deselecting any of these attributes from transfer.
Unequal axes handling
If the axes of the label in the source and target dataset do not match, there are several options for the transfer. Different axes means that the labels have the same dimension (e.g. map, curve) but their axis size or values differs. In this case, you have the following options:
Skip transfer
The label to be transferred is skipped and remains unchanged in the target data set.
Overwrite
The label to be transferred is overwritten in the target data set. It then corresponds to the source dataset of axes and values.
Interpolate
Depending on the selected direction, the label in the target is created either by interpolating the values of the source to the targets axes or by interpolating the values of the target to the sources axes. Depending on the attributes selected for the transfer, only certain modes are allowed. For example, the axis must be selected as an attribute for interpolation from source to target. If the interpolation direction is reversed, the values must be selected as attributes. You can decide whether the last value outside of the axis is to be clipped or extrapolated.
Unequal dimension handling
If the dimension of the label in the source and target dataset does not match (e.g. map <-> curve), the label cannot be converted. In this case, you have the following options:
Skip transfer
The label to be transferred is skipped and remains unchanged in the target data set.
Overwrite
The label to be transferred is overwritten in the target data set. It then corresponds to the source dataset of and values.
Common axis handling
If the label in the target dataset has common axis shared with some other labels, you need to decide how to handle the affected labels because inside one dataset common axis must have the same values for all labels. So you have the following options:
Adjust affected labels of common axis (interpolate values)
All affected labels in the target data set are adapted to the new axis. The values are interpolated accordingly. You can decide whether the last value outside of the axis is to be clipped or extrapolated.
Adjust affected labels of common axis (keep values)
All affected labels in the target data set are adapted to the new axis. However the values are not changed. This option does only apply if the dimension of the source and target axis are the same.
Do not modify affected labels of common axis
All other affected labels in the target data set are not changed. The label itself will be transferred.
Skip transfer
The label to be transferred is skipped and remains unchanged in the target data set as well as all other affected labels in the target dataset.
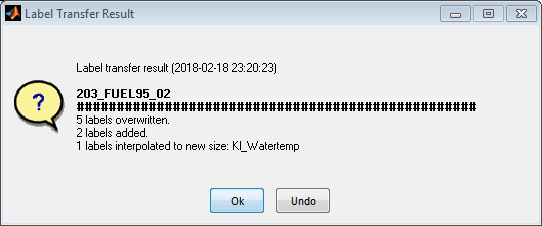
After the transfer a summary of the actions taken will be displayed and provides the possibility to undo the changes.
5.3 Reset labels
By resetting labels (Ctrl + F3) they will be set to their initial values after loading them into the CompareArtist. This can be useful for example to undo changes resulting from a label transfer between datasets.

Datasets
Select the dataset to reset labels from.
Labels to reset
Select the labels to reset. You can select whether to copy all labels, the labels of the comparison result table, the highlighted labels or the selected labels from the comparison result table only. Additionally the labels can be selected manually.
Attributes to reset
Select whether to reset the values and/or the axes of the labels. In case the size of the label and its initial values to not match, the values and axis attribute must be selected to perform the reset - otherwise the label will be skipped.
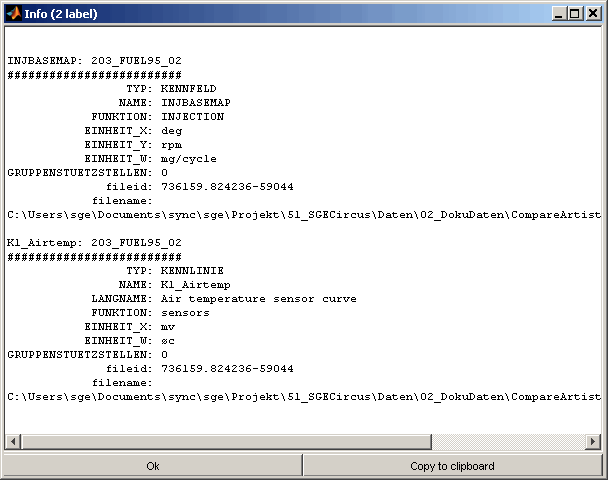
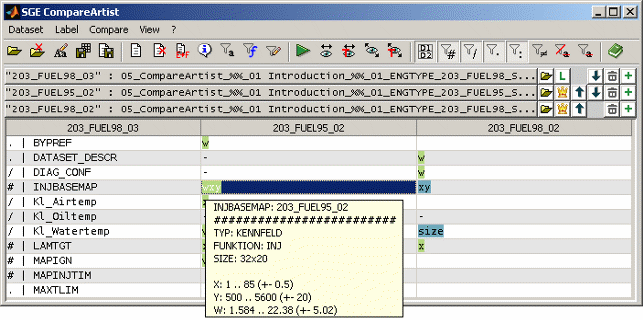
5.4 Label info
After running a comparison it is possible to show the information available for one or multiple marked labels (Ctrl + i).
When clicking onto a label and hovering the mouse afterwards a tool tip will be shown containing information for this label including the ranges of values and axes, its size and some descriptive information. Also the maximum difference to master labels values is shown if available and their size does agree.
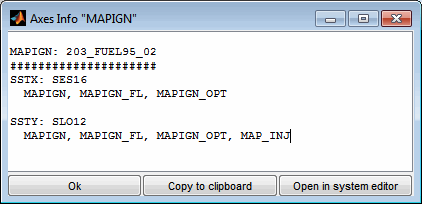
5.5 Axes info
To determine all labels sharing common axes the axes info is available.
5.6 Highlight labels
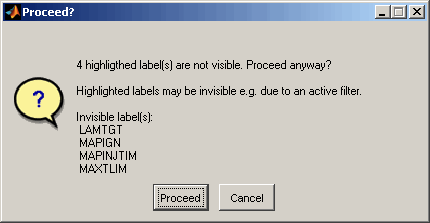
Labels can be highlighted (Ctrl + h) which means that they are emphasized in the comparison result table and their names are remembered even if they are not present in the comparison result table e.g. due to an active filter.
Highlighting can be used to collect a set of labels for later usage. For example highlighted labels may be copied to clipboard or saved / exported.
When highlighted labels are not contained in the comparison result table you will be warned when they get involved for e.g. copying or saving purposes.
5.7 Rename labels
Sometimes a comparison of labels is required whose names do not match. While this can be done using “Visualize all (cross comparison)” there is another option to realize this comparison that is much more comfortable for a high number of labels. A good example is an engine with two banks and therefore two ECUs with separate datasets. Lets imagine an bank identifier is appended to the names of the labels of both banks – _B1 for bank 1 and _B2 for bank 2.
By renaming the label names (Ctrl + F2) to remove the bank identifiers we get the same label names for both banks which enables a comfortable comparison.
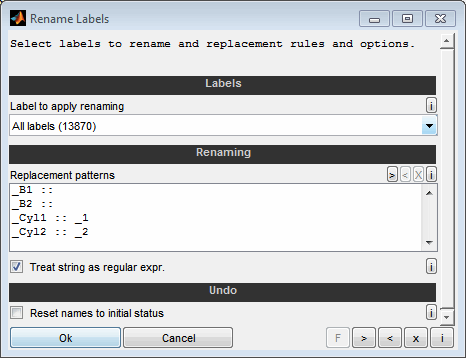
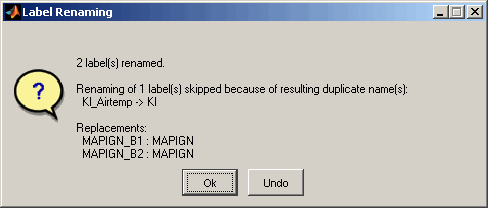
You can rename label names or using replacement patterns (Ctrl + F2). The new names must be unique for the single datasets. Otherwise they will be skipped while renaming.
When renaming the label names the replacement patterns must be given one rule per line. The string to look for and the replacement are separated by two colons, like "EngineSpeed :: RPM". The replacement is case sensitive and done in the order of lines from top to bottom. If the corresponding check box is set the strings are interpreted as regular expression.
After the editing was done a message will inform about the label name modification and allows to undo the changes.
You can also undo the renaming and change the labels to their initial names. In this way it is possible to temporarily adjust the label names of e.g. the banks or ECUs, for example, and bring them back to their original state after processing.
5.8 Save / export label names
Label names can be saved to a *.lab-file or can be transferred to the ETAS INCA ADM. You can select whether to copy all labels, the labels of the comparison result table, the highlighted labels or the selected labels from the comparison result table only. Additionally the labels can be selected manually.
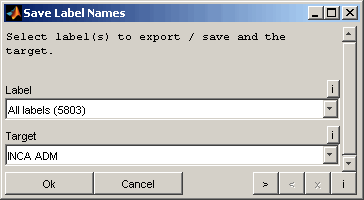
To transfer label names to the ETAS INCA ADM some conditions must be met. INCA and the ADM must a started and a proper source dataset must be inserted that contains the labels to transfer. As it is not possible to check the transfer result automatically the user must check manually that the label names were transferred successfully. The Monitor window of the ETAS INCA software may contain useful information regarding the transfer success.
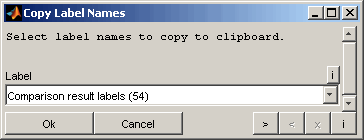
5.9 Copy label names
Label names can be copied to clipboard (Ctrl + c). You can select whether to copy all labels, the labels of the comparison result table, the highlighted labels or the selected labels from the comparison result table only. Additionally the labels can be selected manually.
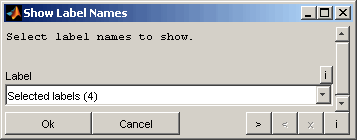
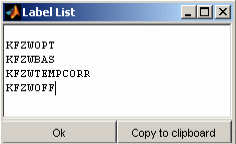
5.10 Show label names
Label names can be visualized as a list. You can select whether to show all labels, the labels of the comparison result table, the highlighted labels or the selected labels from the comparison result table only. Additionally the labels can be selected manually.
6 Comparison result
6.1 Comparison table
The comparison detects differences between the labels of the different datasets. The comparison tolerance can be specified to ignore small differences e.g. resulting from decimal numbers. Choose the corresponding menu item to select the desired tolerance.
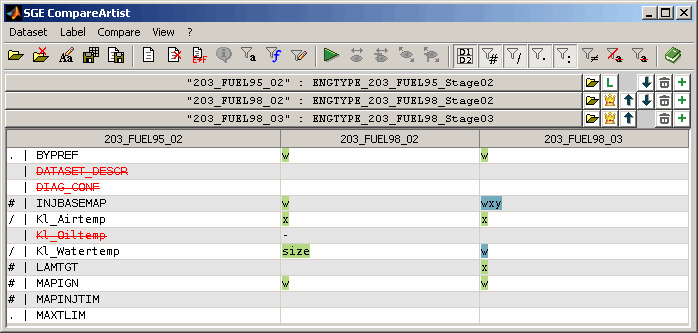
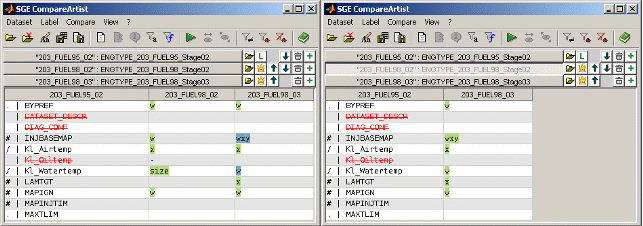
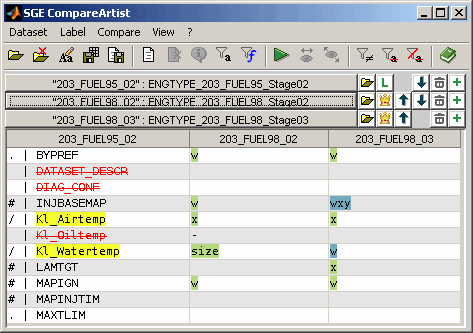
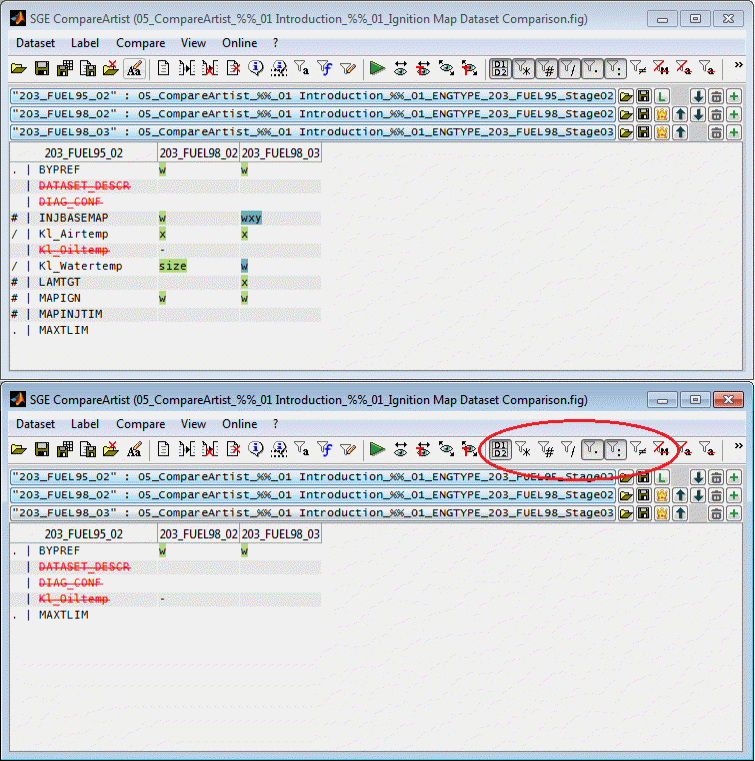
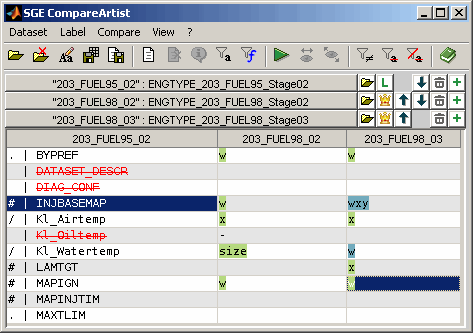
After running a comparison (Ctrl + r) a typical view looks like in the following figure.
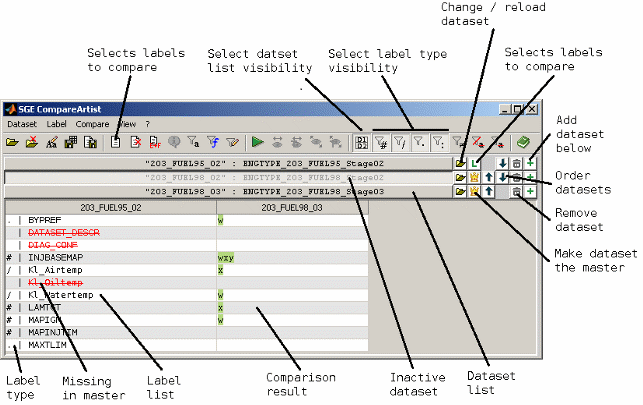
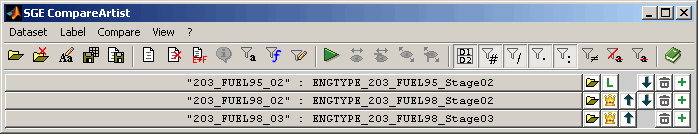
Top section
The top section contains the list of loaded datasets, their short names (if any) and the buttons to arrange and delete the datasets. The visibility of this section can be turned off (F6) to maximize the bottom section area.
Bottom section
The bottom section contains the table with the compare result. Each column represents one dataset. The fist column lists the label names for the master dataset. If it is selected to show only diffs (Ctrl + d) the list will only contain labels that differ to the master for at least one dataset.
The remaining columns display the compare result for one dataset each. Signs are used to indicate the type of difference (e.g. axes, values, size). The following table gives a overview of the denotation of the signs and entries in the table. Multiple signs may be combined in one table cell.
|
Sign |
Description |
|
|
If a label is missing in the master dataset the label name is struck out and colored red. As a comparison is always done to the master no comparison is done for missing labels. |
|
- |
The label is missing in the compared dataset. |
|
size |
The size or type of the label differs compared to the master. |
|
x |
The x axis values differ compared to the master. |
|
y |
The y axis values differ compared to the master. |
|
w |
The values differ compared to the master. |
|
* |
Cuboid label type (3D+) |
|
# |
Map label type |
|
/ |
Curve label type |
|
. |
Parameter label type |
|
: |
Axis label type |
Background colors are used to group datasets that are equal for a label but differ from the master. Therefore it is easy to identify common differences.
6.2 Filter
The view of the compare result can be adapted by using filters. These can be configured using a dialog available from the corresponding menu item or a keyboard shortcut (Ctrl + f).
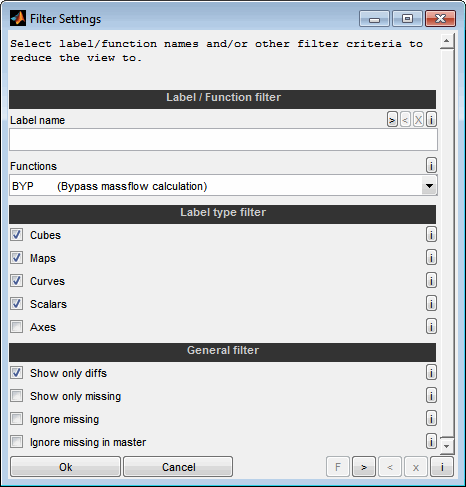
Label name
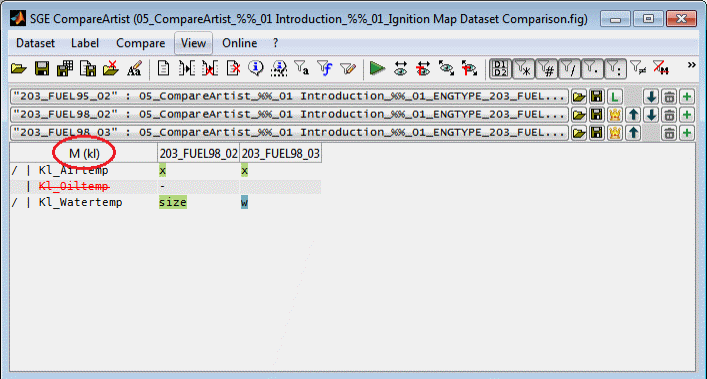
Set a label filter based on their name. Enter the label name to reduce the view to. The wildcard * can be used to match any characters. If the filter string starts with a / the expression will be evaluated as a regular expression.
Alternatively you can just type in the filter expression using upper case letters regardless of the case of the function. The active filter will be displayed in the table header of the master dataset.
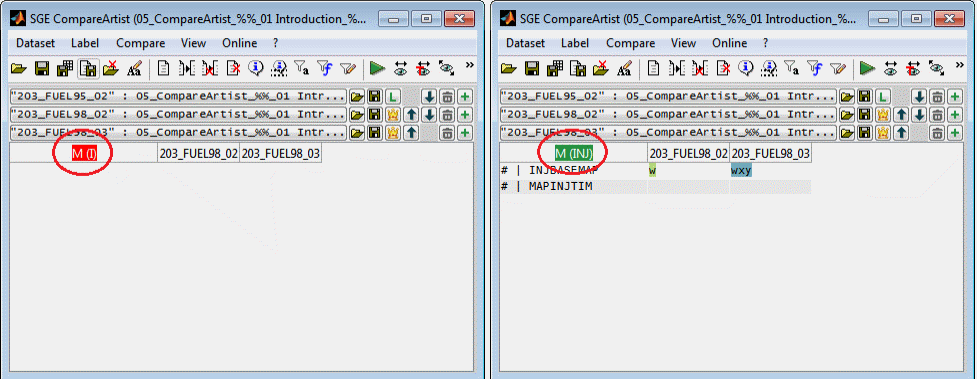
Function
Set a label filter based on their function.
Alternatively you can just type in the filter expression using upper case letters regardless of the case of the function. No wildcards must be used. The active filter will be displayed in the table header of the master dataset. As long as the filter oes not match any function it is colored red. Otherwise it is colored green.
Label type filter
Choose which label types the compare result table should include.
General filter
Show only diffs
Choose whether the compare result table should only list labels that differ for at least one dataset or should contain all labels to compare even if they do not differ.
In case no "Ignore missing" option is active, missing labels will be regarded as difference and therefore shown. If at least one "Ignore missing" option is active, missing labels will not be regarded as a difference.
This options does also influence the "Ignore missing..." behavior. In case the "Show only diffs" option is active, missing labels will be shown anyway and the “Ignore missing...” option is ignored. See “Show only missing / Ignore missing” for details.
Show only missing
Choose whether the compare result table should only list labels that are missing in at least one dataset.
Ignore missing
Choose whether the compare result table should ignore labels that are missing in at least one dataset. So with this option being active only labels will be shown that exist in all datasets.
However, if the option "Show only diffs" is active at the same time, labels that differ in at least one dataset are shown even if they are missing in other datasets.
This options does also influence the "Show only diffs" behavior. In case no "Ignore missing" option is active, missing labels will be regarded as difference for "Show only diffs". If at least one "Ignore missing" option is active, missing labels will not be regarded as a difference.
See “Show only missing / Ignore missing” for details.
Ignore missing in master
Choose whether the compare result table should ignore labels that are missing in the master dataset. So with this option being active only labels will be shown that exist in the master dataset.
However, if the option "Show only diffs" is active at the same time, labels that differ in at least one dataset are shown even if they are missing in the master dataset.
This options does also influence the "Show only diffs" behavior. In case no "Ignore missing" option is active, missing labels will be regarded as difference for "Show only diffs". If at least one "Ignore missing" option is active, missing labels will not be regarded as a difference.
See “Show only missing / Ignore missing” for details.
6.2.1 Filter by label names
To show only a compare result for a reduced set of labels based on their names just type in lower case letters regardless of the case of the label name. The wildcard * can be used to match any characters. If the filter string starts with a / the expression will be evaluated as a regular expression.
The active filter will be displayed in the table header of the master dataset. An active filter can be removed at once (Esc).
6.2.2 Filter by function names
To show only a compare result for a reduced set of labels based on their functions just type in upper case letters regardless of the case of the function name. No wildcards or regular expressions must be used.
The active filter will be displayed in the table header of the master dataset. As long as the filter does not match a single function exactly it is colored red. Otherwise it is colored green. The comparison table will only show labels if the filter matched at least one function exactly.
An active filter and can be removed at once (Esc). The function filter may also be set using a dialog (Ctrl + f).
6.2.3 Filter by label type
It can be defined which label types (maps, curves, scalars, axes) the compare result table should list.
The label type filters may also be set using a dialog (Ctrl + f).
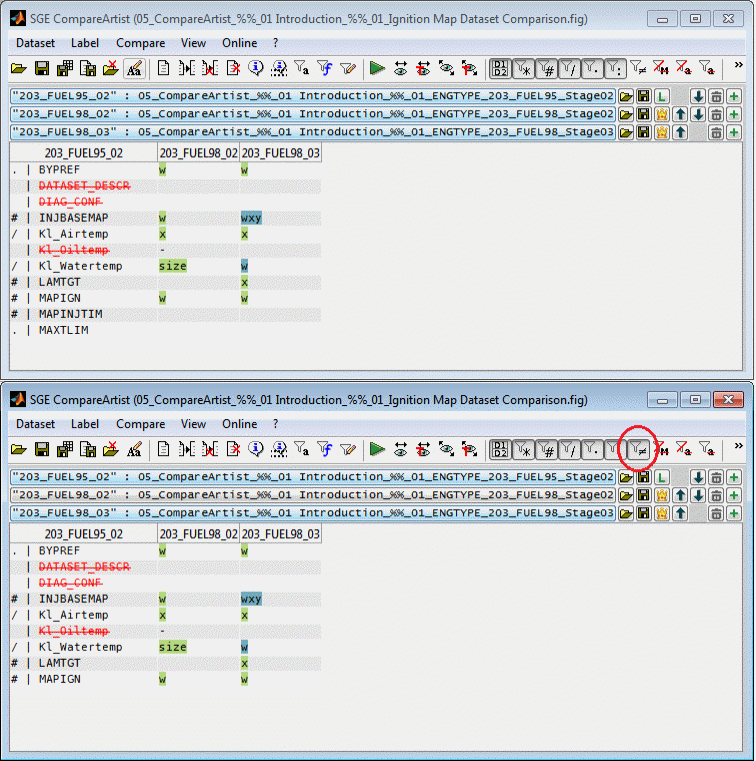
6.3 Show only diffs
It can be defined (Ctrl + d) whether the compare result table should only list labels that differ for at least one dataset or should contain all labels to compare even if they do not differ.
In case no "Ignore missing" option is active, missing labels will be regarded as difference and therefore shown. If at least one "Ignore missing" option is active, missing labels will not be regarded as a difference.
This options does also influence the "Ignore missing..." behavior. In case the "Show only diffs" option is active, missing labels will be shown anyway and the “Ignore missing...” option is ignored.
6.4 Show only missing / Ignore missing
It can be defined (Ctrl + m, Ctrl + Shift + m) whether the compare result table should only list or ignore labels that are missing in at least one dataset. Additionally the option to ignore labels missing in master is available. This functionality can be used to quickly obtain an overview regarding missing and new labels or to remove missing labels from the comparison result.
However, if the option "Show only diffs" is active at the same time, labels that differ in at least one dataset are shown even if they are missing in other datasets.
This options does also influence the "Show only diffs" behavior. In case no "Ignore missing" option is active, missing labels will be regarded as difference for "Show only diffs". If at least one "Ignore missing" option is active, missing labels will not be regarded as a difference.
6.5 Table font size
The font size of the comparison result table can be adjusted using the corresponding menu items or keyboard shortcuts (Ctrl + +, Ctrl + -).
7 Visualization
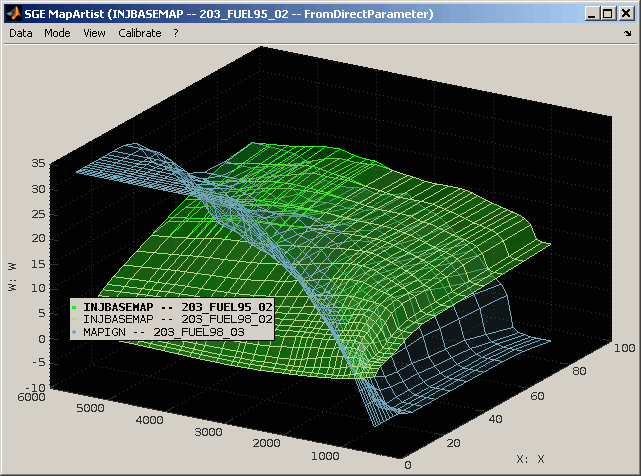
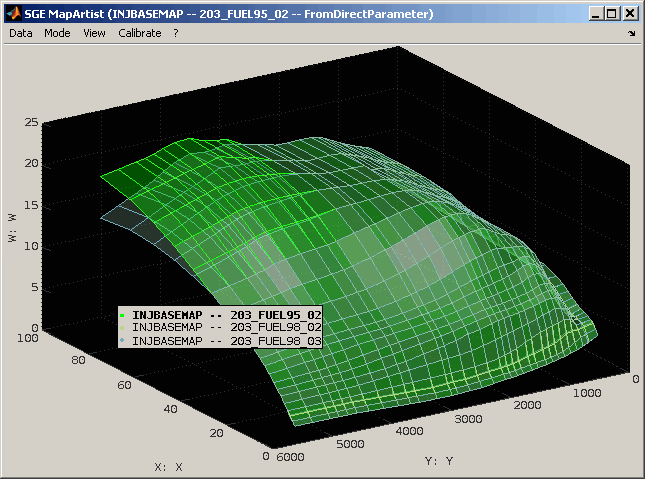
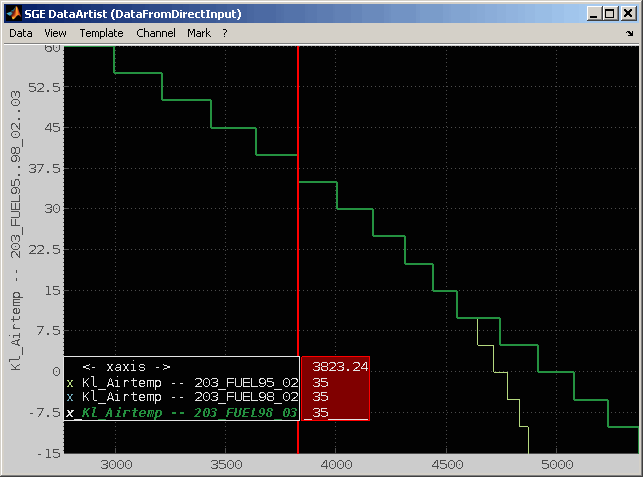
7.1 Visualize (standard comparison)
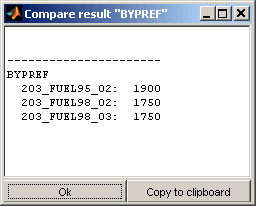
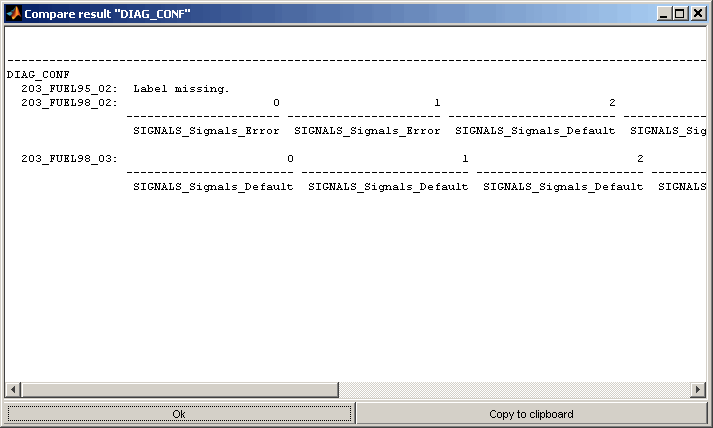
The values of the labels marked in the table can be shown in a comparative view (Ctrl + w, Double click). Depending on the type the label (map, curve, scalar, text) the presentation is chosen to be graphically or textually. Not monotonous axes of maps will result in textual output. It is also possible to force textual output (Ctrl + t).
In this mode for each label marked in the table a separate representation of the comparison is shown. The representation will always contain the label of all datasets even if the label was only marked for one dataset. If a label is missing in a dataset or its type or size does not match the master it will be excluded.
7.2 Visualize all (cross comparison)
This special visualization mode (Ctrl + Shift + w) allows to compare labels e.g. with different label names. Different to the normal visualization the representation will not be done separately for the marked labels but combined. And also in contrast only the marked table cells will be considered. So not all datasets will be considered but only the marked ones.
Depending on the type the label (map, curve, scalar, text) the presentation is chosen to be graphically or textually. It is also possible to force textual output (Ctrl + Shift + t).
If a label is missing in a dataset or its type or size does not match the master it will be excluded.
8 Online
8.1 Online mode
The online mode links typical actions with keyboard shortcuts that are active even when the CompareArtist is not in the foreground. This makes it easy to perform frequently used actions such as visualizing labels or adding them to an ETAS INCA experiment from anywhere. No matter where you work on your computer or with which software - copy the information to be used (=label names) into the clipboard and execute a key combination that is linked to an action in the CompareArtist.
To activate the online mode use the corresponding menu / toolbar entry or the keyboard shortcut (Ctrl + F12). While the online mode is active it listens periodically for the configured keyboard shortcuts and clipboard content.
8.2 Configure online mode
The keyboard shortcuts and associated actions can be configured so that they do not overlap with the software you use to copy label names.
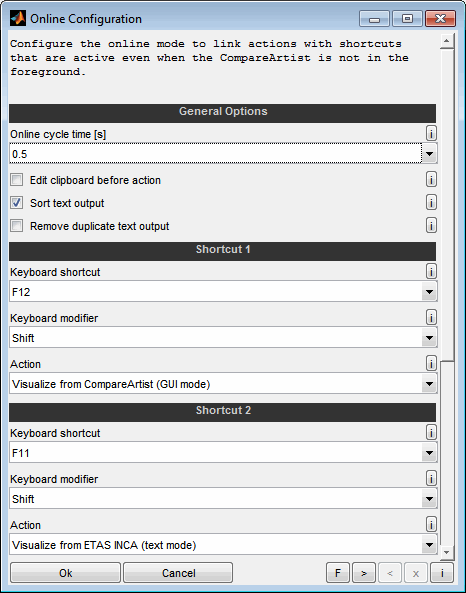
Online cycle time [s]
Specify the interval of the online cycle and thus the frequency of keyboard shortcuts.
Edit clipboard before action
By default, when a shortcuts is executed, the linked action is executed immediately and applied to the contents of the clipboard. If this action is active, the clipboard is displayed first and can be controlled and edited.
Sort text output
As long as the text output window is remaining opened, new content gets appended at the end. Acticate this option to sort the output instead.
Remove duplicate text output
As long as the text output window is remaining opened, new content gets appended at the end. Acticate this option to remove duplicate text output. So when the same labels are visualized multiple times with this option action only the most recent output is kept.
Shortcuts
Configure the keyboard shortcut and modifiers that and the correlated actions. The following actions are available.
Ask
This option ensures that you are asked which action to perform every time.
Visualize from CompareArtist (GUI mode)
The labels from the clipboard will be visualized in the standard graphical way for all datasets loaded in the CompareArtist. Therefore at least one dataset must be loaded and the comparison result table must be filled because the labels to visualize must be included in the table.
Visualize all from CompareArtist (GUI mode)
The labels from the clipboard will be visualized in the standard graphical way for all datasets loaded in the CompareArtist in a common view to enable the comparison of different labels. Therefore at least one dataset must be loaded and the comparison result table must be filled because the labels to visualize must be included in the table.
Visualize from CompareArtist (text mode)
The labels from the clipboard will be visualized textually for all datasets loaded in the CompareArtist. Therefore at least one dataset must be loaded and the comparison result table must be filled because the labels to visualize must be included in the table.
Show CompareArtist elements info
For the labels from the clipboard the CompareArtist elements info will be shown. Therefore at least one dataset must be loaded and the comparison result table must be filled because the labels to visualize must be included in the table. The info shown always origins from the master dataset.
Visualize from ETAS INCA (GUI mode)
The labels from the clipboard will be visualized in the standard graphical way after retrieving its data from ETAS INCA software.
Visualize from ETAS INCA (text mode)
The labels from the clipboard will be visualized textually after retrieving its data from ETAS INCA software. As long as the text output window remains open the new content will be appended. Use the corresponding options to keep the output sorted and/or unique.
Add to ETAS INCA experiment
The labels from the clipboard will be added to the current ETAS INCA experiment.
9 Organize
9.1 Window handling
Since the SGE Circus offers to open a considerable number of windows an automatic window handling feature is implemented. Using the corresponding menu item enables to arrange all or a subset of the windows of the current session.
Close windows
This feature enables to close visible and invisible windows automatically.
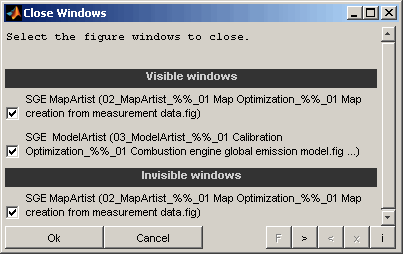
Windows
Select which windows to close. The windows will be closed without saving anything and without any further confirmation. Visible and invisible windows will be listed separately.
Resize windows
This feature enables to automatically set windows to fixed sizes or to maximize, minimize and restore them.
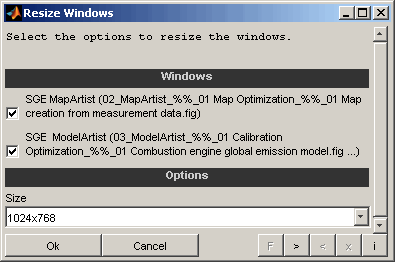
Windows
Select which windows to resize.
Size
Select the desired window size. It is possible to maximize, minimize and restore windows. Additionally a set of fixed standard sizes are available.
Arrange windows
This feature enables to automatically arrange windows.
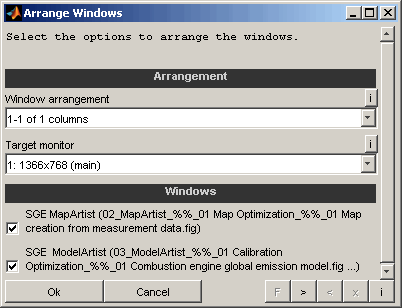
Window arrangement
Select the layout of the arrangement. It is possible to maximize, minimize, restore or close all selected windows. Additionally column and row based layouts are available.
Example: "2-3 of 5 rows" means that the screen is split into 5 rows and the second and third row is used for the layout.
Target monitor
Select the target monitor for the windows to arrange in case of multiple monitors are connected to the computer.
Windows
Select which windows to include into the arrangement.
Toggle windows periodically
This feature enables to automatically toggle windows to create kind of a movie. This can be used to compare windows.
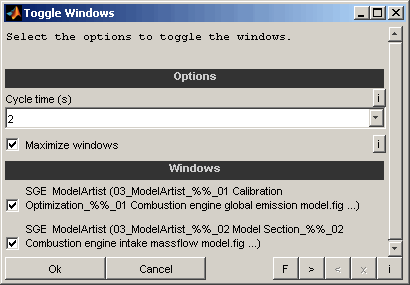
Cycle time
Select the the time to wait before activating the next window.
Maximize windows
If enabled the windows will be maximized before toggle to ensure identical size.
Windows
Select which windows to toggle periodically.
10 Save session
The whole session including data can be stored as file (Ctrl + Shift + s). After re-opening the whole functionality can be used again immediately.
Session files can be opened the same way as dataset files or using the SGE Circus or SGE Viewer. Apart from saving a session it is possible to save datasets to files and transfer datasets to ETAS INCA software, see section “Save datasets“ for details.
11 General information
Duplication, processing, distribution or any form of commercialization of the documents content beyond the scope of the copyright law shall require the prior written consent of the SGE Ingenieur GmbH. All trade and product names given in this document may also be legally protected even without special labeling (e.g. as a trademark).
MATLAB, Simulink and Stateflow are registered trademarks of The MathWorks Inc., Natick, MA, USA.
INCA is a registered trademark of ETAS GmbH, Stuttgart.
The SGE Circus includes Third Party Software. For details please refer to the → SGE Circus documentation.
SGE Ingenieur GmbH – www.sge-ing.de
Copyright 2011-